July 24, 2010

Week 10


Here are two of my maps for Week 10. It's been a pretty frustrating week, but one thing that I did learn is if something doesn't seem to be working the way it should then start fresh. Save the layers and close Arcmap and change servers. It's as if Arcmap freezes up but you can't really tell except that things aren't working the way they are supposed to.


July 8, 2010

This map shows the frequency of Auto Thefts during certain times of the day. As you can see, evenings tend to have the most, followed by afternoons.


This map shows the police stations of Washington, D.C. and the crimes committed in the area. With this map, you can see where the most crimes are committed and where there may be a need for more police stations. I recommend the two locations symobolized with a yellow star for new police stations. I chose these two locations because they seem to have a high crime rate and could use some more protection. The graph shows you each police station and the amount of crimes committed near each one.

June 18, 2010

Week 6 - Alachua County


These are my 3 maps of Alachua County. The top map shows a comparison between the evaluation criteria being equally weighted or proximity having more weight. I still ended up choosing about the same locations either way. The second map shows all four comparisons. And the last map is just a base map.

I had a few troubles with the instructions and got lost a few times, but just had to go back and reread. I'm feeling a little overwhelmed with ArcMap right now. It seems like you could use this software for 20 years and still not know all of the options and intricacies.

June 13, 2010

Deep Horizon Oil Extent Animation

Deep_Horizon_Oil_Extent

The Role of GIS in Disaster Response

Today, Geographic Information Systems (GIS) plays an important role in disaster response and recovery. For example, it can be used to assess the extent of damage, provide infrastructure data to response teams, assist in the allocation of aid funds, and keep the community informed among many other uses.

GIS is used to assess the damage from a disaster by providing visual maps of the area of damage and the extent of the damage. In the Deep Horizon Oil Spill, GIS has been used to provide information to the public as well as recovery and aid units. Using GIS, we know the location of the pipe, the spread of the oil and the possible trajectory of the spill. This data has been integral in allowing communities along the coasts to prepare and be proactive in mitigating the damage as the spill progresses.

Response teams use infrastructure data to speed up their recovery efforts. It can provide them with information on damaged roadways, water infrastructure and electricity grids. With this information at hand they are able to make the best decisions for the speediest recovery. With infrastructure data, the Deep Horizon recovery has been able to find the best locations for ports, command centers and staging areas.

Part of disaster response and recovery includes allocating the aid funds and assessing those in most need of aid. GIS is able to provide visual information of the most damaged areas, and those most in need. Once the Deep Horizon well is shut down, assessment of the damage and hardest hit areas will be next in the recovery steps. The government and BP will have to make decisions on who, where and how the aid will be distributed.

Using GIS, the government and BP have been able to keep the world informed about the Deep Horizon oil spill. Maps have been used to display the movement of the oil, the extent of the shoreline damage, and damage to sensitive wildlife habitats.

June 9, 2010


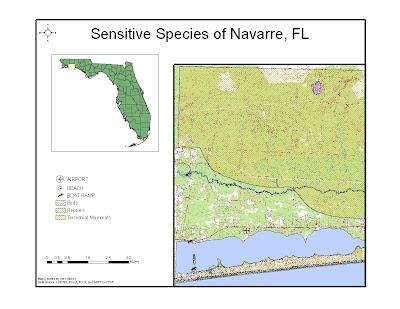
These are two ESI maps created for Navarre, FL used to aid in the cleanup of the Deep Horizon Oil spill in the Gulf of Mexico.

I was excited at first to do this project, but it proved to be the most challenging. I had trouble reprojecting the raster file and I'm not happy with the results of these maps. The raster file just doesn't look right and I'm not sure how to make it look any better.

June 2, 2010

Week 3 - Coastal Flooding from Hurricane Katrina


I didn't really have any trouble with this week's assignment. I used the map cache tool that was posted on the discussion board. What a lifesaver...or at least a frustration saver.
It seems that it could take years and years for a person to learn all of the functions and tools within ArcMap. It's nice to know I'm catching on to some of them.